Monitoring Tool - Grafana
Grafana is an open-source data visualization and monitoring tool commonly used for analyzing and monitoring time-series data. It provides a rich set of features and functionalities that make it popular among DevOps teams, system administrators, and data engineers.

Grafana is an open-source, nightly built dashboarding, analytics, and monitoring platform that is tinkered for connection with a variety of sources like Elasticsearch, Influxdb, Graphite, Prometheus, AWS Cloud Watch, and many others.
Data Visualization: Grafana offers various visualization options like graphs, charts, and tables.
Data Source Integrations: It supports many data sources, including popular time-series databases and cloud monitoring services.
Dashboards: Grafana allows users to create customizable dashboards to monitor and analyze data.
Alerting and Notifications: Users can set up alerts and receive notifications based on specific conditions.
Plugins and Extensions: Grafana has a vast ecosystem of plugins and extensions to extend its functionality.
User Management and Permissions: It provides user authentication and access control features for secure data access.
Templating and Variables: Grafana supports dynamic dashboards and flexible data exploration through templating and variables.
Community and Integration: It has an active community and integrates well with other monitoring tools.
Why Grafana?
Grafana is favored for data visualization and monitoring due to these reasons:
Versatile Visualizations: Grafana offers a wide range of customizable visualizations.
Broad Data Source Support: It integrates with various data sources, allowing consolidated data analysis.
User-Friendly Interface: Grafana has an intuitive interface suitable for technical and non-technical users.
Thriving Community: Grafana benefits from an active community, providing plugins and extensions.
Alerting and Notifications: It provides robust alerting capabilities and supports multiple notification channels.
Dynamic Dashboards: Grafana supports template variables for interactive and personalized dashboards.
Cross-Platform Compatibility: It works across different operating systems and integrates with various tools.
Open-Source and Active Development: Grafana is open-source, regularly updated, and responsive to user needs.
Grafana's flexibility, user-friendliness, broad support, and active community contribute to its popularity in data visualization and monitoring tasks.
What type of monitoring can be done via Grafana?
Grafana is used for various types of monitoring, including:
Infrastructure Monitoring: Monitoring system health, resource utilization, and network traffic.
Application Monitoring: Tracking application-specific metrics like response times and error rates.
Cloud Monitoring: Monitoring cloud resources and services from providers like AWS and Azure.
Container Monitoring: Monitoring containerized environments, resource usage, and service availability.
Network Monitoring: Tracking network latency, bandwidth usage, and device performance.
IoT Device Monitoring: Monitoring IoT devices and sensor data for environmental conditions.
Business Metrics and Analytics: Visualizing business metrics and key performance indicators.
What databases work with Grafana?
Grafana supports a variety of databases that can be used as data sources for visualization and monitoring. Some of the popular databases that work with Grafana include Prometheus, InfluxDB, Graphite, Elasticsearch, MySQL and PostgreSQL, Microsoft SQL Server, Cloud Provider Databases like Amazon Web Services (AWS) RDS, Google Cloud SQL, and Azure Database. It also works with other databases that include TimescaleDB, OpenTSDB, and SQLite.
What are metrics and visualizations in Grafana?
Metrics: Metrics refer to the numeric data points that represent various aspects of a system, application, or infrastructure. These metrics could be performance-related data like CPU usage, memory consumption, network traffic, response times, or any other measurable quantity. Metrics are collected over time and are typically stored in a time-series database.
Visualizations: Visualizations in Grafana are graphical representations of metrics that allow users to interpret and understand data more easily. Grafana offers a wide range of visualization options, including line graphs, bar charts, pie charts, tables, heat maps, gauges, and more. These visualizations help users identify patterns, trends, anomalies, and relationships within the data.
What is the difference between Grafana and Prometheus?
Data Visualization:
Grafana: Grafana is primarily focused on data visualization and offers a wide range of customizable visualizations, including graphs, charts, and tables. It provides a user-friendly interface for creating interactive and visually appealing dashboards that consolidate data from multiple sources.
Prometheus: Prometheus has basic built-in visualization capabilities, but they are more limited compared to Grafana. It primarily focuses on data collection, storage, and querying, rather than providing extensive visualization options.
𝗗𝗮𝘁𝗮 𝗖𝗼𝗹𝗹𝗲𝗰𝘁𝗶𝗼𝗻:
Grafana: Grafana does not directly collect data. It relies on connecting to data sources, such as Prometheus or other databases, to fetch metrics and display them in visualizations.
Prometheus: Prometheus directly collects time-series data through a pull-based model. It has its own lightweight server that collects metrics from monitored targets, making it self-sufficient in data collection.
𝗗𝗮𝘁𝗮 𝗦𝘁𝗼𝗿𝗮𝗴𝗲:
Grafana: Grafana does not have its own data storage. It leverages various data sources, including Prometheus, which has its own storage mechanisms for time-series data.
Prometheus: Prometheus has its own time-series database where it stores collected metrics. It provides efficient storage and retrieval of time-series data, optimized for monitoring and analysis.
𝐀𝐥𝐞𝐫𝐭𝐢𝐧𝐠:
Grafana: Grafana supports alerting, but it relies on data sources like Prometheus to provide the underlying alerting functionality. It can visualize and manage alerts triggered by Prometheus or other data sources.
Prometheus: Prometheus has built-in alerting capabilities. It allows users to define alerting rules and thresholds based on collected metrics. Prometheus can independently send notifications when alerts are triggered.
𝗤𝘂𝗲𝗿𝘆𝗶𝗻𝗴:
Grafana: Grafana provides a unified query interface to query data from various data sources, including Prometheus. It offers a powerful query editor that supports different query languages and provides a convenient way to retrieve and manipulate data.
Prometheus: Prometheus has its own query language called PromQL. It allows users to query and aggregate metrics based on specific conditions, time ranges, and mathematical operations. PromQL is optimized for querying time-series data.
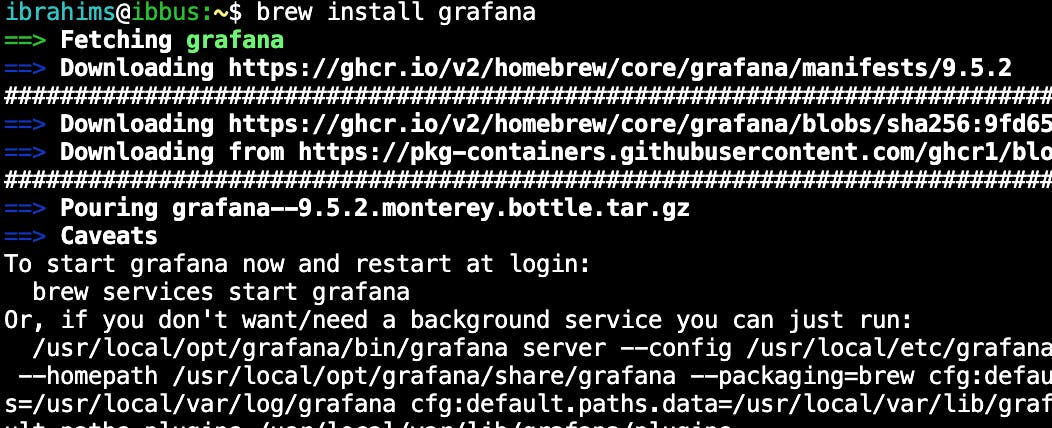
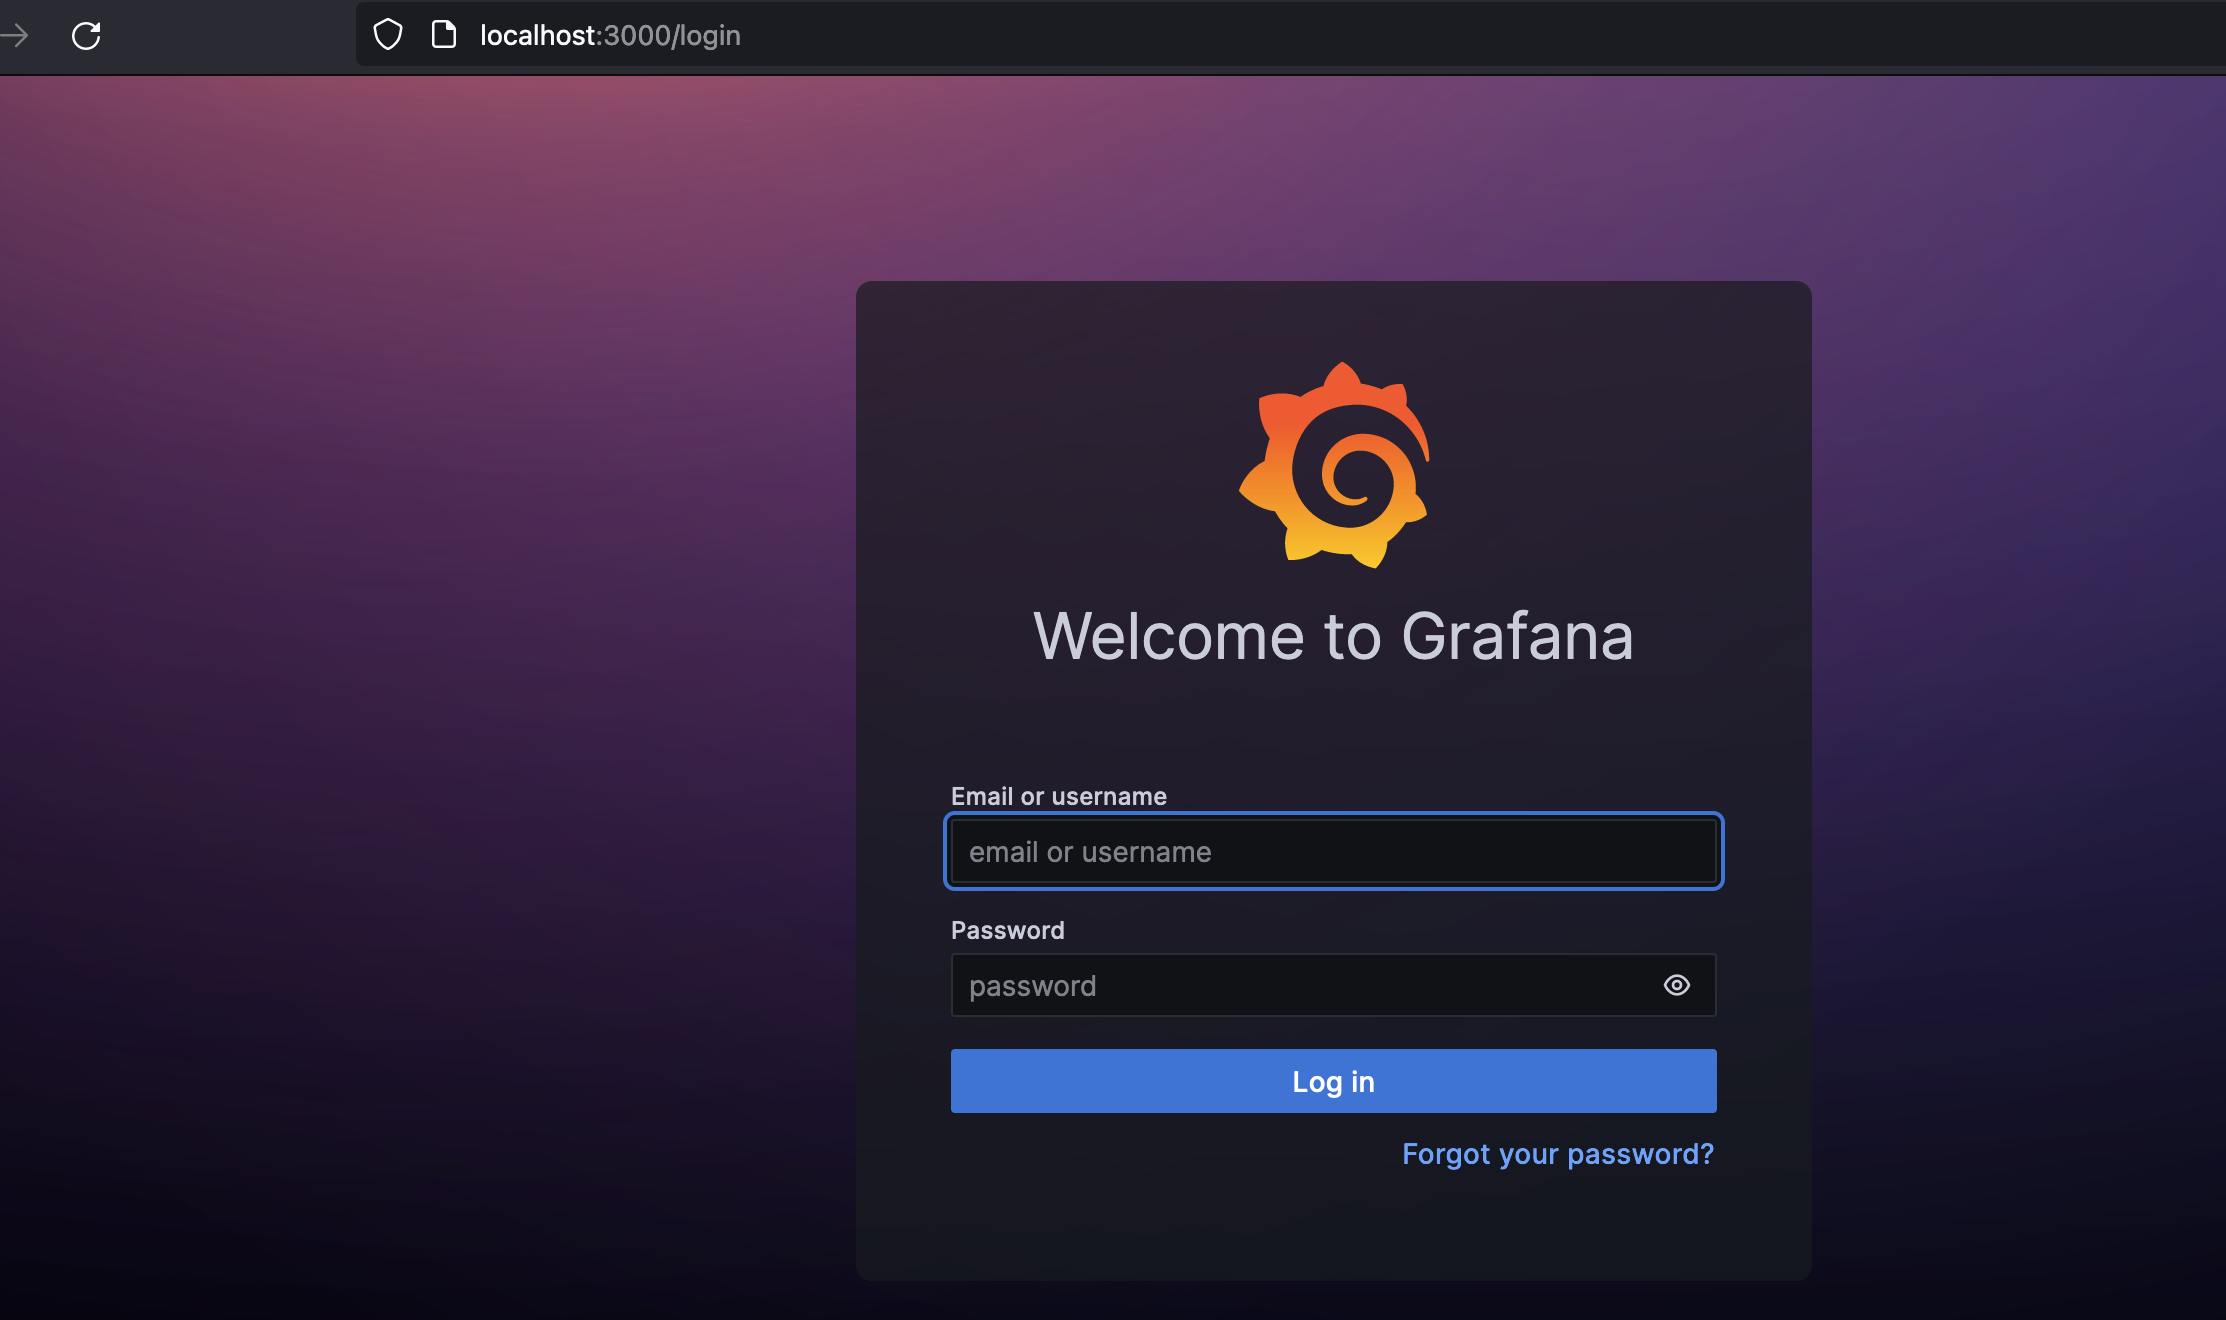
Install Grafana on macOS using Homebrew
brew update

brew install grafana

brew services start grafana

localhost:3000


